NBA Salary Prediction Model
"Scoring, minutes, defense and age explain 62% of the variation in NBA salaries, and 5-fold cross-validation holds that up"
- Course: STAT 3220, Introduction to Regression Analysis (fall 2025)
- Data: 184 players from the 2024–25 season averaging 20+ minutes a game (Basketball Reference stats and contracts, Statista franchise values)
- Tools: R (
lm, car, olsrr, caret): multiple linear regression on log salary, 5-fold cross-validation - Process: EDA, VIF checks for multicollinearity (dropped a PTS × FTA interaction at VIF ≈ 23), stepwise selection, nested F-tests for the categorical predictors, residual and influence diagnostics
- Result: adjusted R² = 0.62; 5-fold cross-validation matched the in-sample fit (CV R² ≈ 0.62), so no sign of overfitting
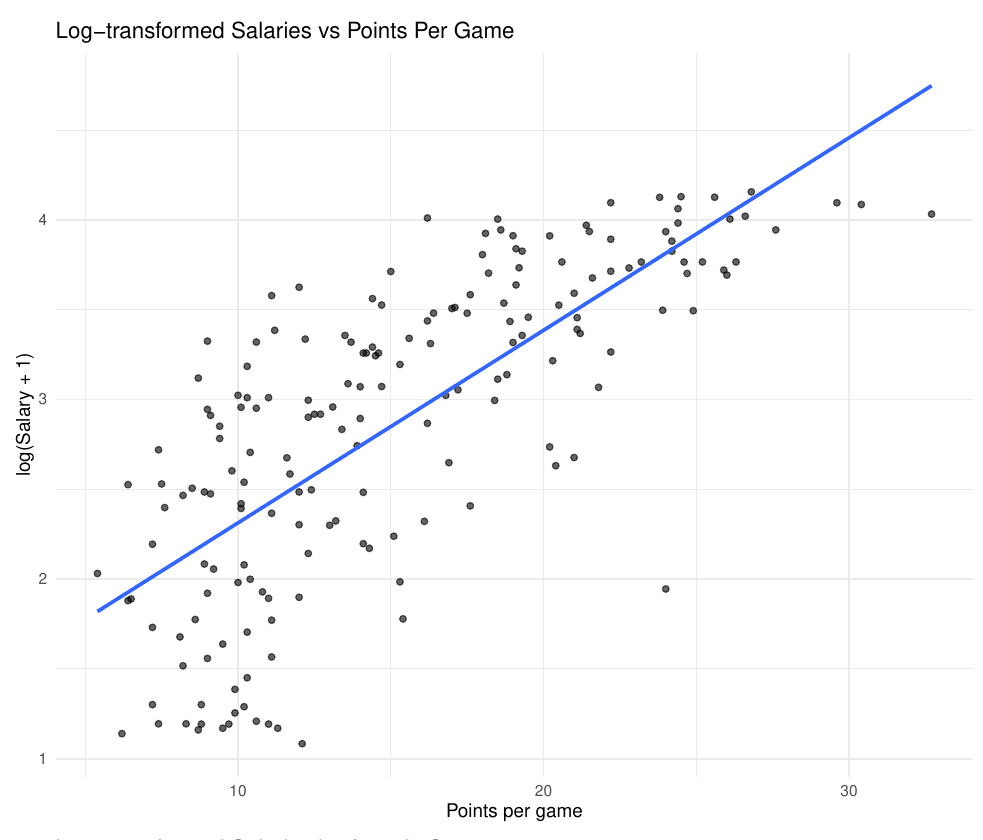
- Findings: points per game was by far the strongest predictor, followed by minutes, defensive stocks (steals + blocks) and age group (27–31 earned significantly more); awards and position added nothing once those were in the model
Why this dataset
A class project for STAT 3220, Introduction to Regression Analysis.
What the diagnostics caught
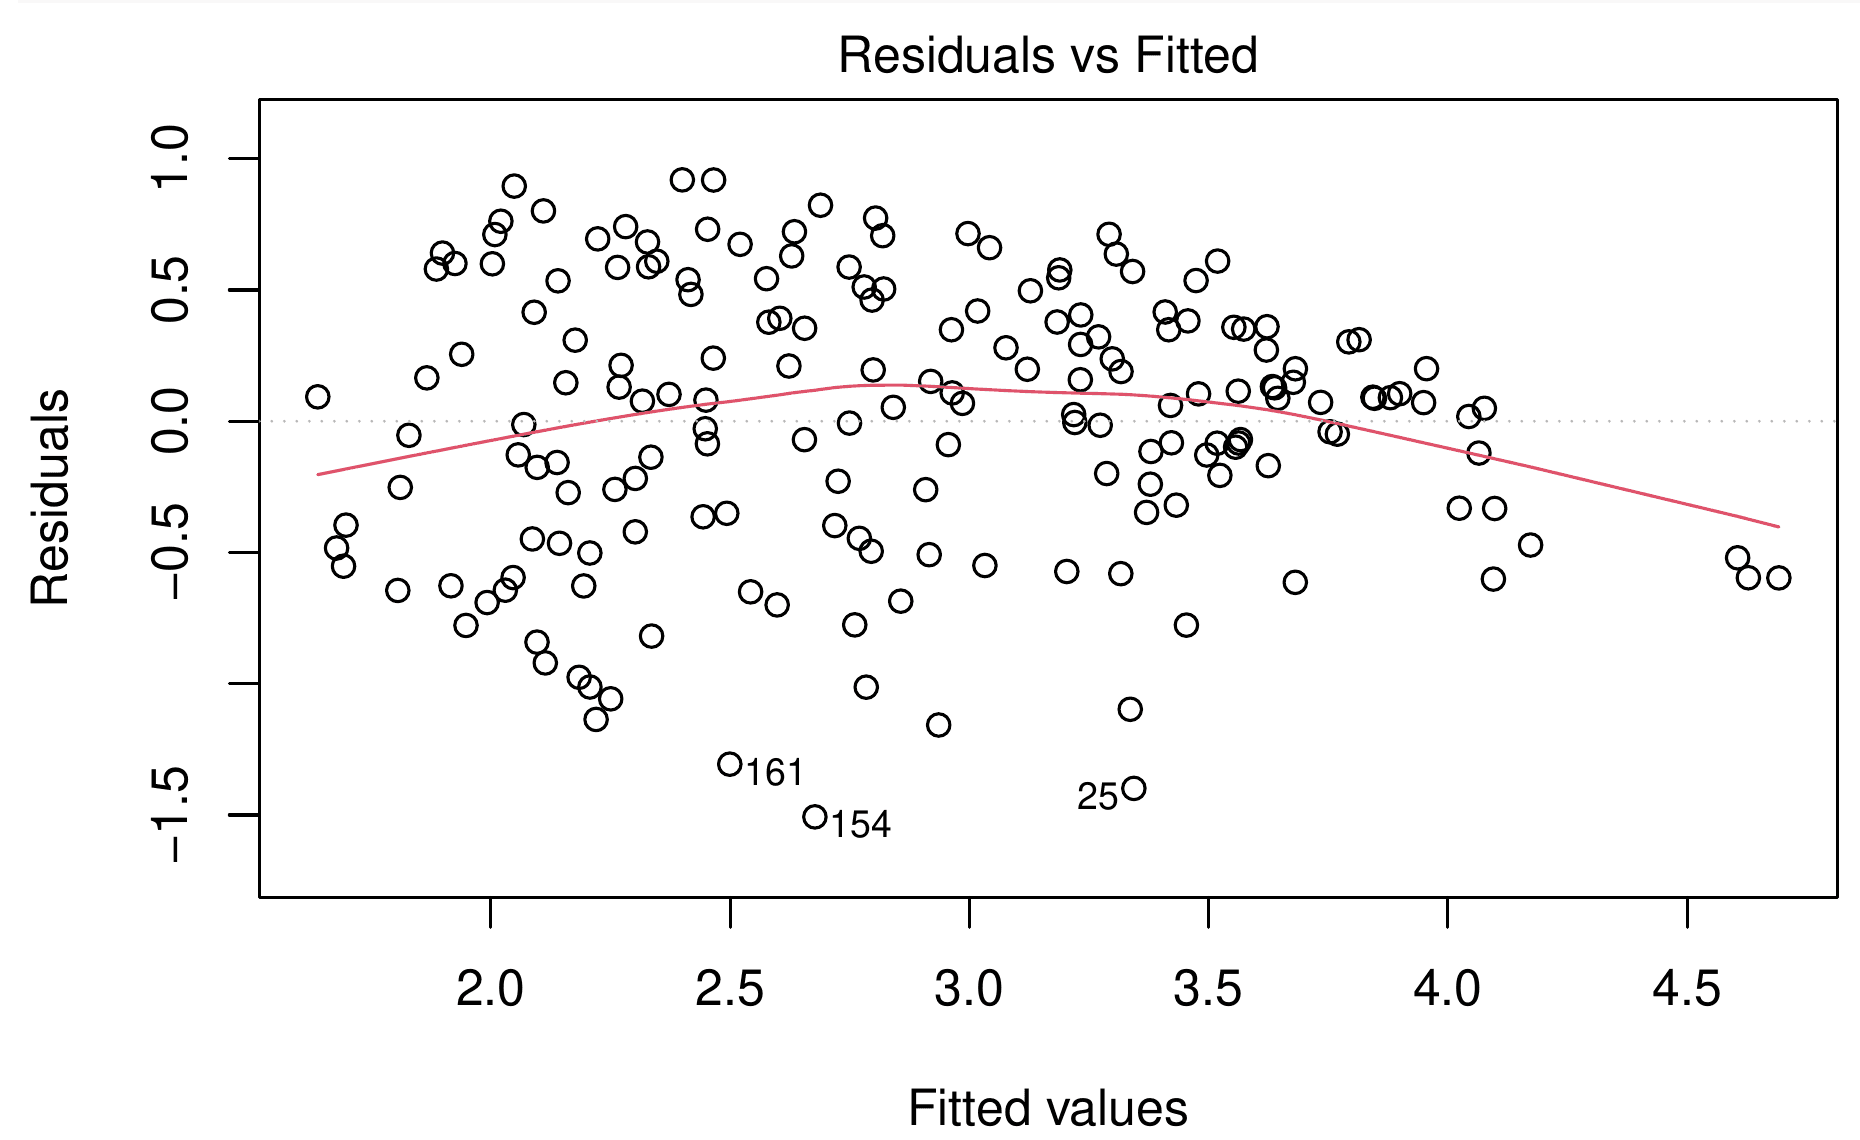
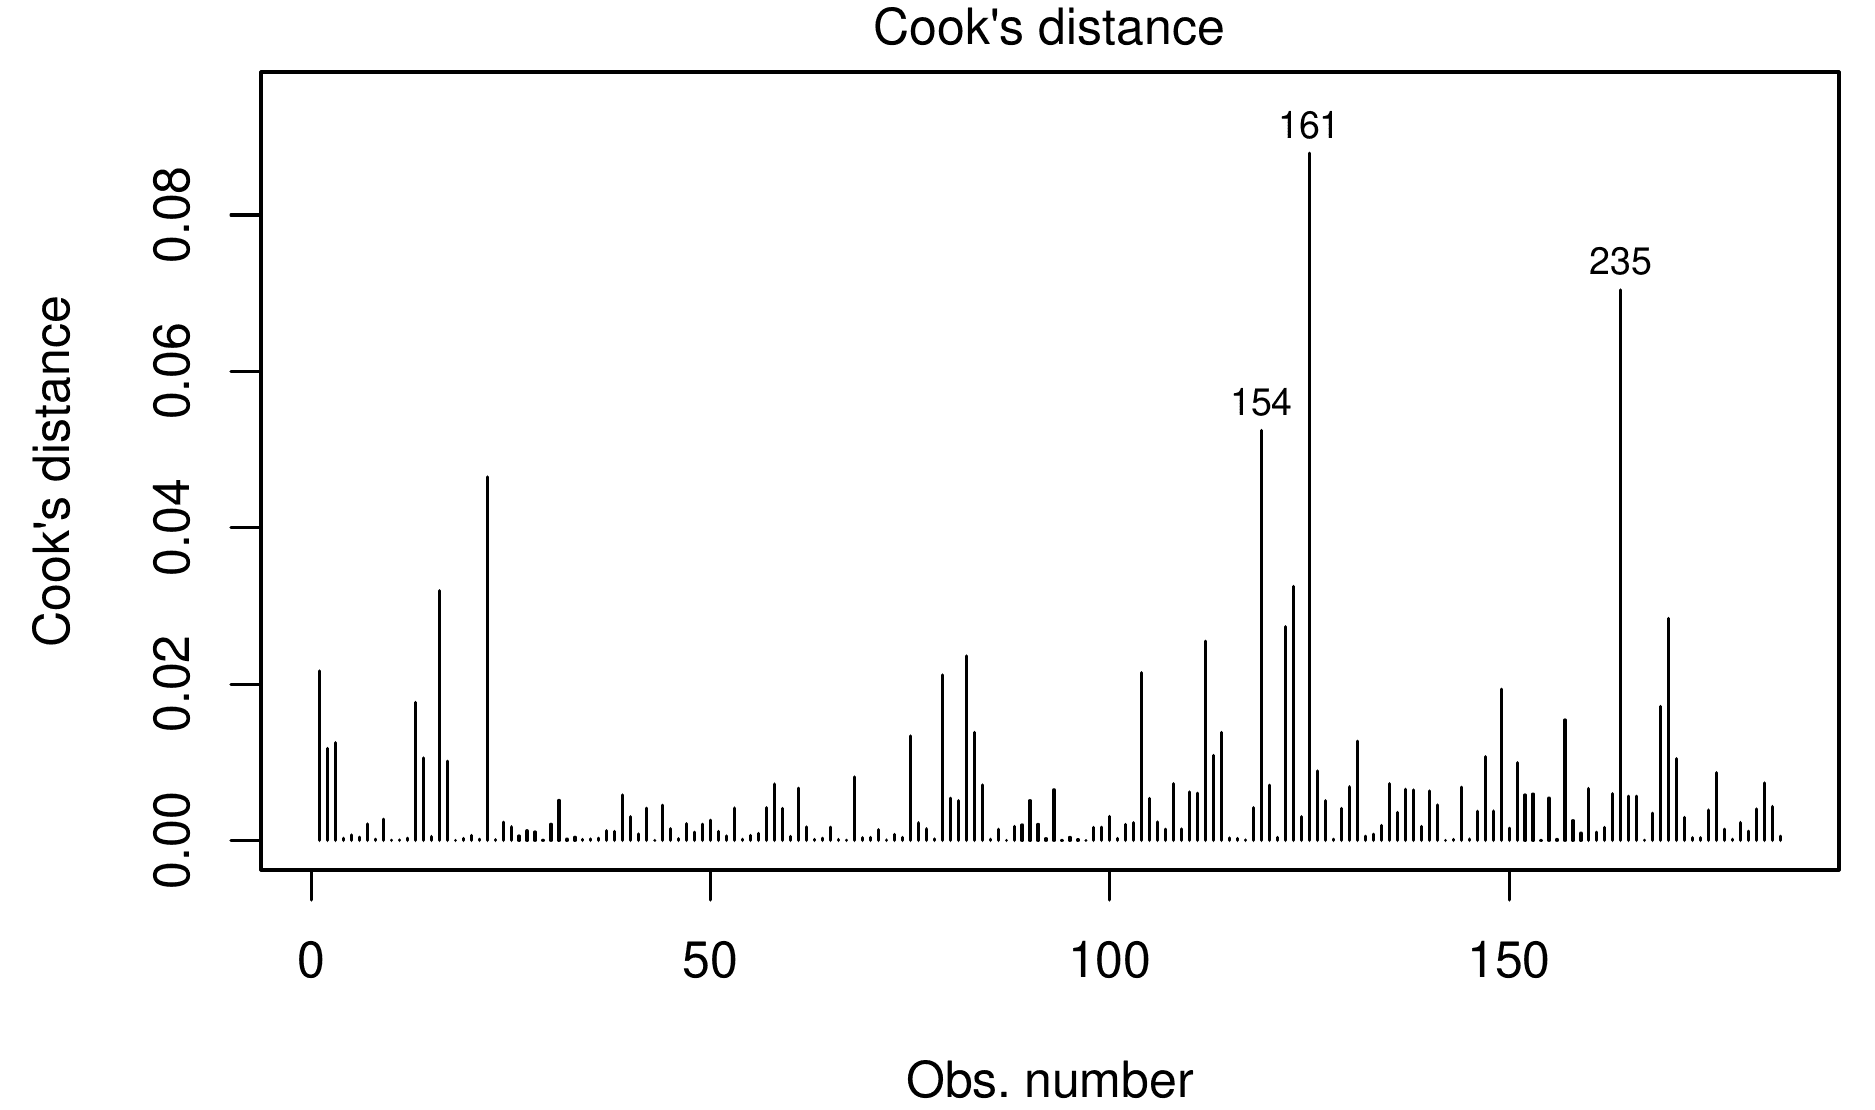
Cook's distance, leverage and studentized residuals flagged a handful of influential players: Tim Hardaway Jr., Chris Paul and Toumani Camara. All three were paid far below what their production predicts, around $2.3 million a year while playing 28 to 33 minutes a game. Rather than silently dropping them, we kept them in the final model and marked two for a follow-up sensitivity analysis. The diagnostics also pointed at what the model is missing: salary depends on things the box score doesn't record, like when a contract was signed, injuries, reputation and the league's salary-cap rules. That's where I'd take the model next, along with regularization (ridge or lasso) for the correlated predictors.
My contribution
I handled all of the coding and the data-science work for our team: preparing the dataset, and building, selecting, validating and diagnosing the regression models in R.